

Risk and Periodontal Disease Management
John A. Martin, DDS; Roy C. Page, DDS, PhD; Carl F. Loeb, BA
The occurrence and progression of periodontitis is a consequence of the interplay between the infecting bacteria and a susceptible host. Individuals vary greatly in their susceptibility and risk for the disease. Accurate assessment of risk is an essential and integral part of diagnosis and treatment planning. Over- or under-assessment of risk likely results in inappropriate treatment of some patients. There is evidence that traditional risk assessment by subjective clinician judgment is inadequate for use in clinical decision making.
RISK FOR PERIODONTITIS AND ITS IMPLICATIONS
Risk is a prediction of a future event that is typically an unwanted outcome. It is expressed verbally (low, high) or numerically (20 in 100, 85%). Risk can be used in periodontal care to express the likelihood of the progression from health to disease or any current disease state to a more severe state of disease (Figure l). If risk can be shown to be low, then treatment may not be required, as the disease is less likely to progress. If risk is high, then treatment is required, as disease is expected to progress to a more advanced stage. Every patient receiving aggressive periodontal treatment has been implicated by the clinician to be at high risk. If those assessments of risk are accurate, standard treatment protocols for a specific periodontal diagnosis can be established for patients at high risk.
Historically, it was assumed that with advancing age the prevalence of gingivitis decreased and periodontitis increased, and that without intervention gingivitis inevitably would progress to severe periodontitis (Figure 2).1 This engendered the view that all adults with gingivitis were presumed to be at high risk for periodontal disease. Not only do we now know that gingivitis does not always lead to periodontitis,2,3 we also know that the ultimate severity of disease varies for individual patients. That periodontal disease severity is highly stratified in the population can be seen from the third National Health and Nutrition Examination Survey (NHANES III) database, in which Albandar and colleagues determined that 65% of the US adult population over the age of 30 was periodontally healthy, 22% had mild periodontitis, and 13% had moderate to severe periodontitis.4
Whereas disease severity is stratified within the population, so too must the disease risk vary, and when the NHANES data are viewed by age cohort this distribution of disease risk can be determined (Figure 3A, Figure 3B). Because NHANES indicates that the percentage of the population diagnosed with periodontitis increases linearly from 22% for the 30- to 34-year-old age cohort to 57% for the 85- to 90-year-old age cohort, it must be true that approximately 60% of the 30- to 34-year-old cohort were at risk of periodontitis, even if only 22% had actually developed the disease by age 34. Similarly, the data also distinguishes mild from moderate to severe periodontitis, which indicates that the risk for mild periodontitis is 35% and 25% for moderate to severe periodontitis. Because risk for periodontitis is not distributed uniformly throughout the adult population, but rather is stratified, treatment must be personalized for each patient based on the patient’s unique risk profile and disease severity if appropriate care is to be provided.
In order for risk assessment to have clinical utility, it must be accurate. Traditionally, risk has been assessed by expert clinical judgment. The utility of such subjective assessment of risk has been studied and reported on by Persson and colleagues.5 These investigators enrolled 107 subjects into a clinical study. As a group, they manifested a wide range of risk and disease severity. A comprehensive periodontal examination was performed on each subject and a risk score ranging from 1 (lowest risk) to 5 (highest risk) was calculated for each subject using a previously validated periodontal risk calculator.6 Three groups of expert clinicians evaluated the records and assigned a risk score to each using the same scale; the results are shown in Figure 4 (). The percentage of patients who were placed in Risk Groups 3 and 4 by two groups of periodontists was clustered around the proportion of patients placed in these groups by the risk calculator. However, only one periodontist placed as many subjects in Risk Group 5 as the risk calculator and none of the periodontists placed as few subjects in Risk Group 2 as the risk calculator. Data points for general dentists were spread across the entire range. Data points for the periodontists indicated that, as a group, they seriously underestimated actual disease risk, with the reasonable presumption that if treatment was based on an inaccurate assumption of risk, patients would have received inadequate treatment.
The variation for risk determined by clinicians relative to the variation for risk determined by the risk calculator for patients with a risk score of 3 is shown in Figure 5 (). When an expert evaluator scored a test subject as being Risk Level 3 in agreement with the validated risk calculator, this agreement was shown by the dot appearing in the red circle (bulls-eye); if the evaluator scored 4 or 5, the dot was shown above the horizontal line in the inner or outer circle, respectively; if the evaluator scored 2 or 1 the dot was shown below the horizontal line in the inner or outer circle, respectively. It is notable that agreement with the validated risk calculator was only 20%, a level of agreement with a 1 to 5 scale that could have been achieved through a coin toss. Most experts underestimated risk, while some experts overestimated risk. These data indicate that even expert clinicians rate poorly in their judgment of risk and, as a consequence, are likely providing treatments that are inappropriate for many patients. However, these findings should not be unexpected or alarming to dentists because the professional dental literature only provides a laundry list of risk factors with no practical methodology suggested on how to determine risk, leaving the dentist no method other than his or her subjective judgment.
DIAGNOSIS AND RISK
A periodontal diagnosis describes the patient’s current periodontal status, which is limited in accuracy by the sensitivity of the measurement systems and the dynamic, nonlinear disease process that can cycle between breakdown and healing. Diagnosis is not a reliable guide to future periodontal status, which can only be predicted when diagnosis is considered in addition to risk. Diagnosis is determined from signs and symptoms and describes the current disease state, whereas risk assessment uses risk factors to predict change in the current state. Signs and symptoms of periodontal disease include bleeding on probing, the presence of periodontal pockets, alveolar bone loss, pain, and gingival swelling. Risk factors for periodontal disease include cigarette smoking, diabetes, stress, poor oral hygiene, the presence of periodontal pockets, and heredity.7,8 Because the signs and symptoms of periodontal disease are not equivalent to the risk factors for periodontal disease, the method to determine a diagnosis of periodontal disease differs from the method to determine the risk for periodontal disease. Therefore, a comprehensive evaluation of periodontal status requires separate determinations for diagnosis and risk, which together comprise a broader description of a patient’s periodontal status than diagnosis alone. Where subjective methods are used for determining risk there is a natural tendency to equate the level of risk with the severity of disease. While it is certainly true that high severity must equal high risk, it is equally true that low severity provides little or no information on risk level, because health must always precede severe disease.
USING NEW TECHNOLOGY TO DETERMINE PERIODONTAL RISK
The Oral Health Information Suite ([OHIS™], PreViser, Inc., Mount Vernon, Washington) is an Internet-based system that enables objective, accurate assessment of risk on a scale of 1 (lowest) to 5 (highest). The technology helps to identify patients who are developing or are expected to develop periodontal diseases at an early enough stage when simple, relatively inexpensive interventions may prevent or arrest the progression of the disease process. In addition, the technology permits quantitative assessment of therapeutic outcomes as well as changes in risk and periodontal status over time.
The OHIS was not developed to serve as a substitute for the training, experience, and expertise of the clinician but rather to provide dentists with dependable, objective information to improve the quality and accuracy of clinical decision making. OHIS is a bundle of tools available on the Internet at www.previser.com and consists of the periodontal assessment tool (PAT), the caries assessment tool (CAT), and the oral cancer assessment tool (OCAT). These tools provide risk scores for periodontal disease, dental caries, and oral cancer, respectively. In addition, a traditional linguistic diagnosis and a newly developed disease score on a scale of 1 to 100 for periodontal disease are provided along with suggested treatments and interventions specific for the unique characteristics of the patient. Clinicians can direct their patients to a collection of tutorials to find information about oral health and diseases, as well as individualized reports showing the level of disease severity and risk and changes in these levels over time. This article focuses only on the periodontal assessment tool.
The validity and accuracy of the OHIS method to determine the risk for periodontitis has been reported.6,9 For 15 years, 523 subjects were followed in whom less than 10% had self-reported periodontal treatment. Baseline diagnostic data were used to calculate a risk score for each subject. Periodontal status at years six, nine, and 15 was determined from comprehensive periodontal examination with full-mouth radiographs. The risk prediction of the PAT was then compared with actual disease outcomes to determine if a PAT assessment of high risk correlated with the observed disease processes over time. Alveolar bone loss and tooth loss were the primary measures of disease effects, and the correlation between the PAT and predicted disease outcomes was used to determine validity and accuracy of the PAT. The OHIS method consistently categorized subjects by five risk levels where a higher level of risk accurately predicted more mean bone loss, a higher percentage of sites with bone loss, more mean tooth loss, more loss of teeth that were periodontally affected at baseline, and a higher percentage of subjects with tooth loss (Figure 6, Figure 7, Figure 8, Figure 9).
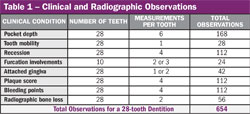
The practicality of using OHIS in clinical practice has been reported7,10 and is based on the ease with which it can be used to accurately determine periodontal disease risk (on a 1 to 5 scale) and severity (on a 1 to 100 scale). OHIS uses only 23 data points, all of which are obtained during a routine periodontal examination. This is a very small subset of typically observed clinical information. By comparison, it is less than 15% of periodontal pocket measurements and less than 4% of all visual and radiographic data generally recorded during a full periodontal examination (Table l). The 23 data points include the deepest pocket and greatest bone loss for each sextant (6 + 6), patient age (1), cigarette smoking history (1), diabetes diagnosis and control (1), dental care frequency (1), oral hygiene (1), history of periodontal pocket reduction surgery (1), and the presence of subgingival calculus, subgingival restorations, furcation involvements, vertical bone lesions, and bleeding on probing (5). Data entry and transmission over the Internet between the dentist’s computer and the OHIS server takes less than 5 minutes and can be done at the convenience of the office staff. In addition to calculating periodontitis risk, OHIS assigns a score representative of the severity and extent of periodontal disease. The score ranges from 1 for health to 100 where all dentulous sextants have severe periodontitis. The method is based on a sextant diagnosis determined from the deepest pocket, greatest bone loss, and bleeding on probing. Not only does the score describe current periodontal status, it provides a quick and simple means to determine improvement or deterioration by the respective decrease or increase in the disease score.
CLINICAL IMPLICATIONS
A lesion must be “visible” to diagnostic methods to establish a diagnosis of disease and determine treatment (Figure l ). Before being visible to a diagnostic method, histopathologic changes occur in advance of being clinically detectable. Therefore, it is impossible to know with certainty that a patient is actually healthy. Risk is the fundamental principle that can be used to justify the aggressiveness of treatment where a diagnosis of disease can be made. Low risk means that disease is unlikely to progress and justification for treatment is minimally supported. High risk means that disease is likely to progress and justification for treatment is maximally supported.
Risk can be used to determine preventive interventions. As shown in Figure 3A and Figure 3B , 40% of the US population does not develop periodontitis, while 60% are at risk for the disease at some time during their lifetime. A negligible proportion of individuals under the age of 30 manifest signs and symptoms of periodontitis, yet they are at risk for the disease (Figure 10). For each age cohort beyond age 30, a progressively increasing percentage of individuals manifest signs and symptoms of periodontitis. Every patient with advanced periodontitis was, at some time previously, periodontally normal. A worthy diagnostic goal is to be able to identify these individuals before the disease process becomes manifest or at an early disease stage when relatively simple and less costly interventions could intercept, reverse, and/or arrest the process. Withholding preventative treatment from healthy, at-risk patients denies them the opportunity to remain healthy and prevent complex periodontal treatment. Risk assessment provides an opportunity to identify these individuals and provide care appropriate to their risk level.
Risk is also used to modulate the intensity and aggressiveness of reparative treatment. For example, treatment for a 75-year-old patient with generalized 6-mm pockets may be limited to periodontal maintenance whereas surgery may be selected for a 35-year-old patient with the same conditions when the risk level of the older patient is much lower than the younger patient.
It is possible to be at high risk and not suffer the consequences of terminal disease by managing the risk factors. Managing risk factors can prevent the occurrence and progression of disease. For example, drugs that lower blood pressure and cholesterol can prevent cardiovascular events and tight control of blood sugar can prevent diabetic complications. In the same way, daily personal oral hygiene that controls bacterial plaque can prevent caries and periodontitis, and periodontal surgery that eliminates periodontal pockets can improve the effectiveness of oral hygiene and periodontal maintenance treatment, and thereby arrest the progress of periodontitis.
OHIS risk and disease scores provide a simple objective means to dynamically determine treatment effectiveness, because lower scores are indicative of improvement and higher scores are in-dicative of worsening. It is beyond the scope of this article to correlate specific clinical conditions with treatment, especially considering the variation of risk and objectives that occurs for patients. It is also not possible within the context of this article to categorically state the lowest scores that define the successful endpoint of treatment for any patient. For example, treatment for a patient who at the initial examination has a risk score of 5 (very high) and a disease score of 100 (generalized severe periodontitis) cannot lower the risk score to 1 (very low) and the disease score to 1 (health). The lowest possible scores will be unique for each patient. The lowest practical scores are determined by the treatment the patient accepts based on his or her objectives. As treatment is done, time progresses, and subsequent OHIS risk and disease scores are determined, the dentist and patient may consider new treatment interventions to produce different outcomes and lower scores.
One aspect of treatment may include the referral of the patient to a periodontist or another general dentist practicing periodontics. It has been reported by Cobb and colleagues that patients referred for periodontal treatment had, at the time of referral, severe disease and, compared to 20 years earlier, had greater tooth loss at the initial periodontal examination, more severe disease, and more teeth planned for extraction.11 Waiting to refer patients until the disease is advanced indicates that the referral decision is based solely on disease severity and does not take into consideration differential disease risk. Because every patient who has severe periodontitis had, at a previous time, mild periodontitis, and before that was healthy, referral standards based solely on disease state clearly do not serve the best interests of patients.
CONCLUSION
OHIS can be easily incorporated in clinical practice to provide an objective, valid, and accurate determination of risk and a simple means to determine changes in periodontal status for treatment planning, including referral to a periodontist.
REFERENCES
1. Marshall-Day CD, Stephens RG, Quigley LF, Jr. Periodontal disease: prevalence and incidence. J Periodontol. 1955;26:185-203.
2. Listgarten MA, Schifter CC, Laster L. 3-year longitudinal study of the periodontal status of an adult population with gingivitis J Clin Periodontol. 1985;12(3):225-238.
3. Page RC. Gingivitis. J Clin Peridontol. 1986;13(5):345-355.
4. Albander JM, Brunelle JA, Kingman A. Destructive periodontal disease in adults 30 years of age and older in the United States 1988-1994. J Periodontol. 1999;70(1):13-29.
5. Persson GR, Mancl LA, Martin JA, Page RC. Assessing periodontal disease risk. J Am Dent Assoc. 2003;134(5):575-582.
6. Page RC, Krall EA, Martin JA, Mancl LA, Garcia RI. Validity and accuracy of a risk calculator in predicting periodontal disease. J Am Dent Assoc. 2002;133(5): 569-576.
7. Page RC, Martin JA, Loeb CF. Use of risk assessment in attaining and maintaining oral health. Compend Contin Educ Dent. 2004;25(9): 657-669.
8. Page RC, Beck JD. Risk assessment for periodontal diseases. Int Dent J. 1997; 47(2):61-87.
9. Page RC, Martin JA, Krall EA, Mancl LA, Garcia RI. Longitudinal validation of a risk calculator for periodontal disease. J Clin Periodontol. 2003;30(9):819-827.
10. Page RC, Martin JA, Loeb CF. The oral health information suite (OHIS): Its use in the management of periodontal disease. J Dent Educ. 2005;69(5): 509-520.
11. Cobb CM, Carrara A, El-Annan E, et al. Periodontal referral patterns, 1980 versus 2000: A preliminary study. J Periodontol. 2003;74(10): 1470-1474.
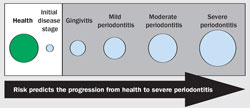 | 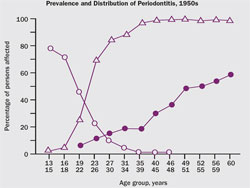 | |||||||||||||||
| Figure 1 The white box represents the clinical conditions that are below the sensitivity of diagnostic methods to detect pathologic change. The gray-shaded box represents the clinical conditions that can be detected with diagnostic methods and the circles indicate increasing severity and extent. | Figure 2 Prevalence and distribution of gingivitis, periodontitis, and tooth loss in the 1950s. From Marshall-Day et al, 1955.1 | |||||||||||||||
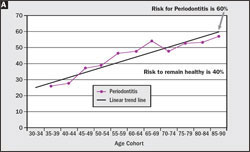 | 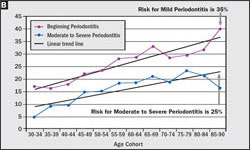 | |||||||||||||||
| Figure 3 (A) Based on the NHANES data set for 1989–1994,4 the percentage of the age cohort who will manifest periodontitis at some time in their life span is 60%, while 40% never manifest the disease. (B) 35% of the population will manifest mild periodontitis and 25% will manifest moderate to severe periodontitis. | ||||||||||||||||
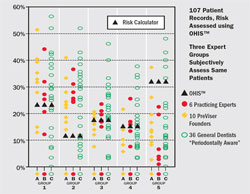 | 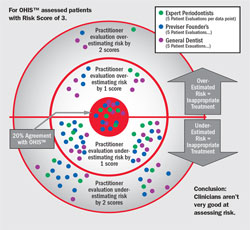 | |||||||||||||||
| Figure 4 Graph of the percentages of the population of 107 patients (vertical axis) placed in each of five risk groups (horizontal axis) by the OHIS™ risk calculator and by each of three groups of expert clinicians designated as Group A (6 practicing periodontists), Group B (10 PreViser Founders who were all periodontists), and Group C (36 general practitioner dentists). From Persson GR, Mancl LA, Martin JA, Page RC. Assessing periodontal disease risk. J Am Dent Assoc. 2003;134(5):575-582. Copyright © 2003 American Dental Association. All rights reserved. Reprinted with permission. | Figure 5 Extent of agreement between the OHIS™ risk calculator and three groups of expert clinicians for patients in Risk Group 3. Each dot represents five patient evaluations. Dots falling in the red circle were in agreement with the risk calculator; when the expert clinician assigned a 4 or 5 instead of a 3, the dots were placed above the horizontal in the inner or outer circle, respectively; when the assignment was 2 or 1 instead of a 3, the dots were placed below the horizontal line in the inner or outer circles, respectively. From Page et al 2004,7 with permission. | |||||||||||||||
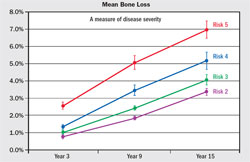 | 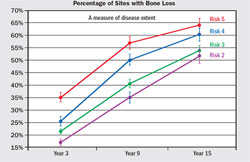 | |||||||||||||||
| Figure 6 Mean (± standard error) alveolar bone loss from baseline for Risk Groups 2 through 5 at sites exceeding the threshold of 2% loss of alveolar bone height for all sites that could be compared. From Page RC, Krall EA, Martin JA, Mancl LA, Garcia RI. Validity and accuracy of a risk calculator in predicting periodontal disease. J Am Dent Assoc. 2002;133(5):569-576. Copyright © American Dental Association. All rights reserved. Reprinted by permission. | Figure 7 Mean percentage of sites (± standard error) with bone height worsening from baseline for years 3, 9, and 15 for Risk Groups 2 through 5. From Page et al 2003,8 with permission. | |||||||||||||||
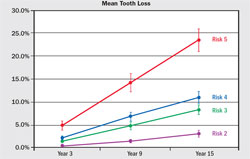 | 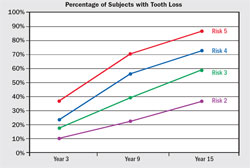 | |||||||||||||||
| Figure 8 Mean (± standard error) tooth loss from baseline for Risk Groups 2 through 5, defined as the percentage of teeth present at baseline that were subsequently extracted. From Page RC, Krall EA, Martin JA, Mancl LA, Garcia RI. Validity and accuracy of a risk calculator in predicting periodontal disease. J Am Dent Assoc. 2002;133(5):569-576. Copyright © American Dental Association. All rights reserved. Reprinted by permission. | Figure 9 Percentage of subjects (± standard error) who lost one or more teeth that were periodontally affected at baseline in Risk Groups 2 through 5 at years 3, 9, and 15. From Page et al 2003,9 with permission. | |||||||||||||||
 |  | |||||||||||||||
| Figure 10 Changes in the proportion of individuals who were at risk for developing periodontitis but did not yet manifest disease (orange), those who were at risk and developed disease (red), and those who were not at risk and did not develop disease (green) by age cohort. Based on the NHANES III data set.4 From Page et al 2005,7 with permission. | Table 1 | |||||||||||||||
| ||||||||||||||||